Using Azure Data Factory to analyze a Cars dataset
Azure Data Factory can be used for various ETL/ELT and Data integration scenarios. Here, I am using it to process and transform data and publish it to Azure Data Lake Storage.
“Car details from Car Dekho.csv” file contains information about used cars. I use this dataset to find the cars that are value for money and are well suited for ones liking.
To achieve this, I curate a list of cars according to a user’s choice, whether one want a First/Second/Third/Fourth & Above Owner Car or a Test Drive Car and whether a user wants a manual or automatic transmission car. I pass these choices as parameters to my pipeline. I chose to analyze only petrol cars.
To ensure that a car is value for money, I filter out only the cars that have a selling price less than the average selling price and the kilo-meters driven less than the average kilo-meters driven.
Setup
You Must have a ADLS storage account setup. This link will help you with it. To store your files. create 2 container. I named one of them as source-etl and the other as sink-etl. Upload your dataset to the source-etl container.
Create a data factory. Link to the setup.
Creating pipelines
We will be creating two pipelines.
-
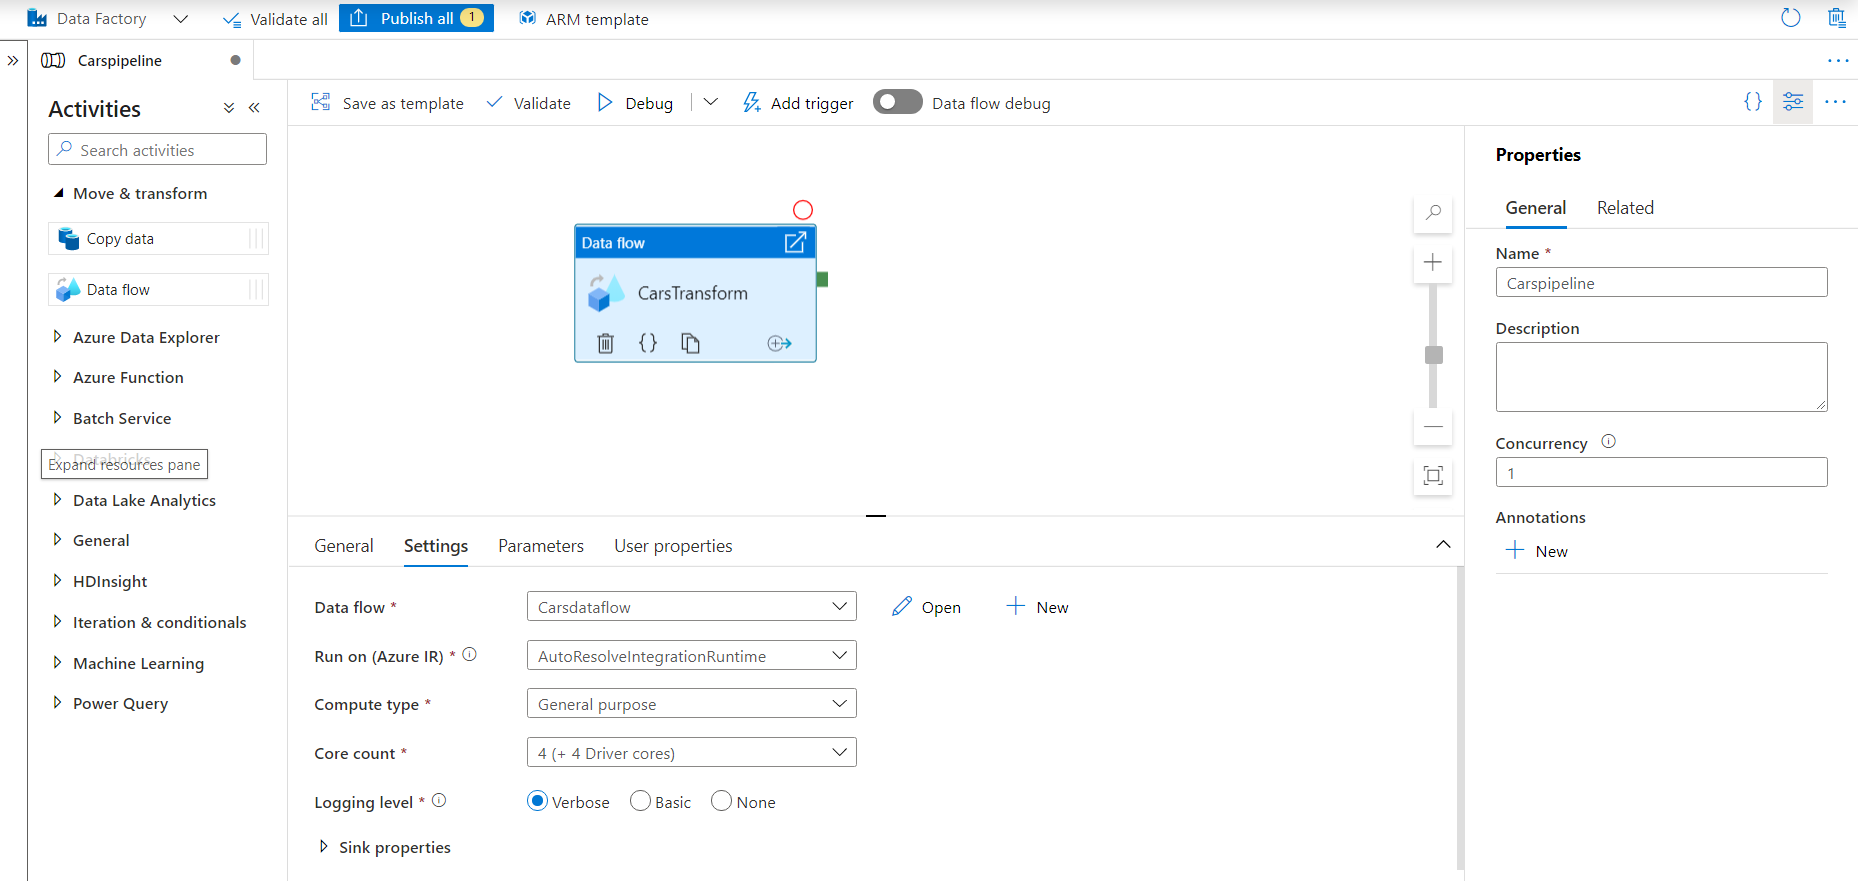
In the Data Factory UI, select create pipeline. In the general tab (on the right-side of the screen) Enter the Carspipeline as the name of your pipeline.
-
From the activities tab, under Move & transform , drag the data flow activity to the pipeline canvas.
-
A pop-up will appear, in its general tab enter CarsTransform as the name.
-
In the settings tab, select New data flow. A new Data Flow window will open. This is the data flow canvas where we will describe our activity. Name it Carsdataflow.
-
Go back to the pipeline canvas and from the activities tab, under General, drag the Execute pipeline activity to the pipeline canvas.
-
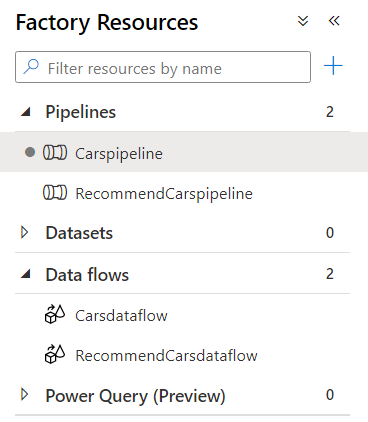
To create another pipeline, right-click on Pipelines, under the Factory Resources pane to create a new pipeline. Name it RecommendCarspipeline. Drag and drop the data flow activity on the pipeline canvas and name it RecommendCarsDataflow.
-
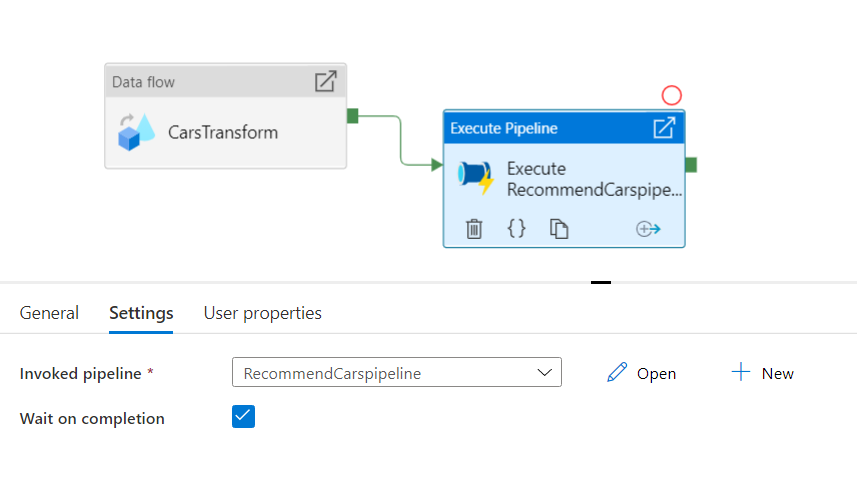
Now, go back to the Carspipeline, click on CarsTransform. Click and hold on the green tip of the activity and stretch it to the Execute pipeline activity.
-
On selecting the Execute pipeline activity, a pop-up will appear. Under the General tab, fill the name box as Execute RecommendCarspipeline and select the RecommendCarspipeline for the Invoked pipeline option, under the Settings tab. Check the Wait on completion checkbox.
Building Transformation logic for Carsdataflow
Here, we’ll build a data flow that takes the “Car details from Car Dekho.csv” in ADLS storage, finds the average selling price, average kilometer driven, total number of cars available and the total number of unique cars available for each owner-type. Then we’ll write this file back to the ADLS storage.
Before doing anything, slide the data flow debug slider on. Debug mode allows for interactive testing of transformation logic against a live Spark cluster. You will be prompted to select which integration runtime configuration you wish to use. Be aware of the hourly charges incurred by Azure Databricks during the time that you have the debug session turned on.
-
In the canvas, click on add source. Under the Source Settings enter ADLSsource as the Output stream name.
-
Select DelimitedText as the source type.
-
For linked service, click on New. A creation screen will open, name your linked service as ADLSlinkedService. Select Azure data Lake Storage Gen2 as type. Select your azure subscription and your Storage account name. Click on create.
-
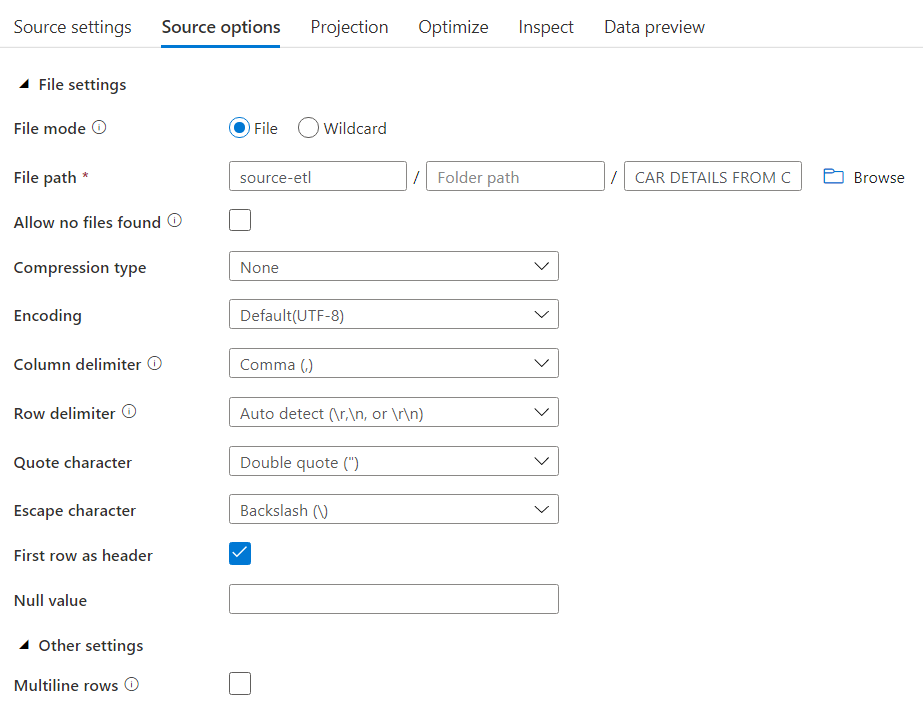
In the Source options tab, select File as File mode, enter the File path and check the First row as header checkbox.
-
In the Data preview tab, click on refresh. Your should be able to see a sample data.
-
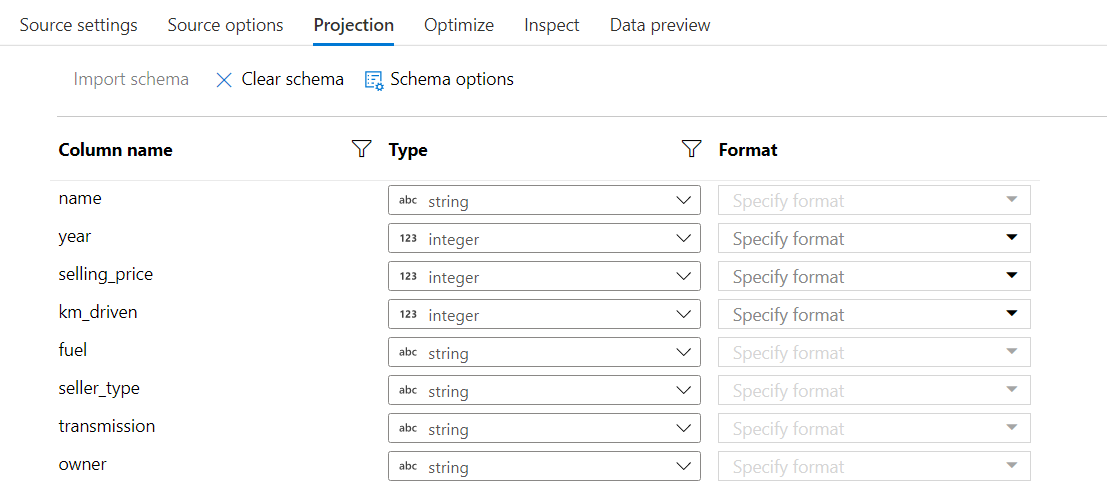
In Projection tab, select Import schema. Your will be prompted to select the default formats of each datatype. After doing the needful, you will be able to see the schema. For this scenario, the schema doesn’t need any correction.
-
In the data flow canvas, click on the plus icon near the source node, to add a new transformation. Select Filter.
-
Fill in the details according to the image below.

When you click on the expression box, a expression builder window opens up. Here, you can write the expression as :
year >= (toInteger(year(currentDate())-6)) && rlike(fuel,'Petrol')This statement simply means that I want to have only the cars that are not more that 6 years old and run on petrol.
I used the
currentDate()function to get the current date. Then I used theyear()function to extract the year from the date and convert it to integer using thetoInteger()function. To find the petrol cars, I used therlike()function to find the pattern ‘Petrol’ in the column fuel.you can verify your logic by clicking Refresh under the preview section, to see its output compared to the inputs used.
-
In the canvas, click on the plus icon for the filter node and add the Aggregate transformation.
-
Fill in the details according to the below image.

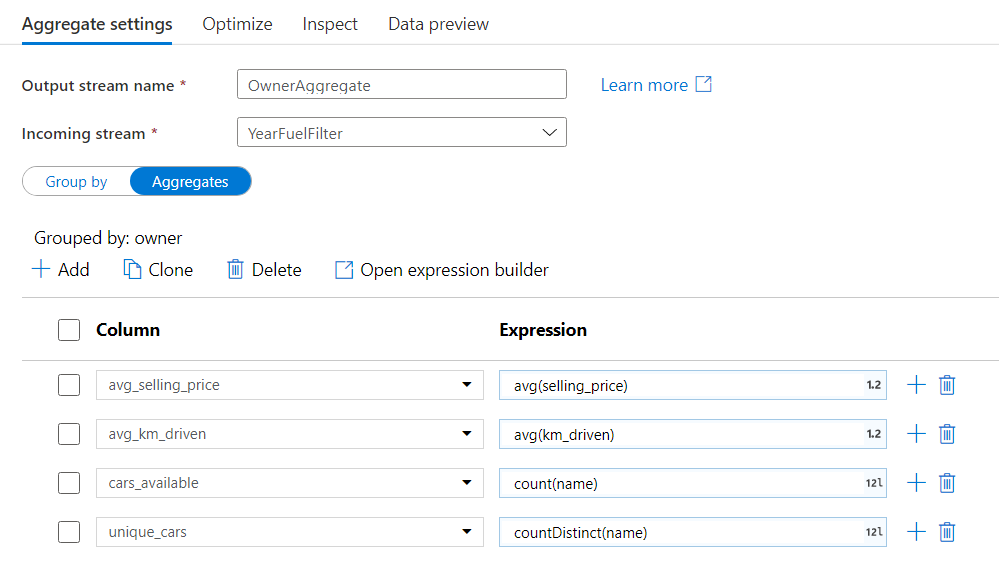
As shown, add each column and write their respective aggregating functions.
I used the
avg()to find the average of a numerical column,count()to count the number of rows andcountDistinct()to count the unique values in a column. -
Next, add the ModifyColumns node and fill the details accordingly. We use the
round()function to round-off the average values as high level of precision is not needed.
-
In the end, add a sink node. Fill the sink tab according to the image below. In the Settings tab, check the first row as header checkbox, select Output to single file in the File name option and name the Output to single file as CarsOutput.csv. These changes will prompt you to change the Partition option to single partition in the Optimize tab.

-
At last, you can click on publish all to save your pipeline. You can also debug a pipeline before you publish it. While data preview doesn’t write data, a debug run will write data to your sink destination. This debug run will also try to trigger the RecommendCarspipeline, which is not complete yet and may throw an error.
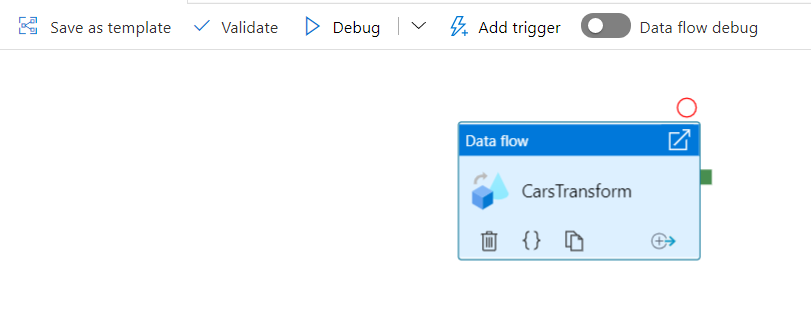
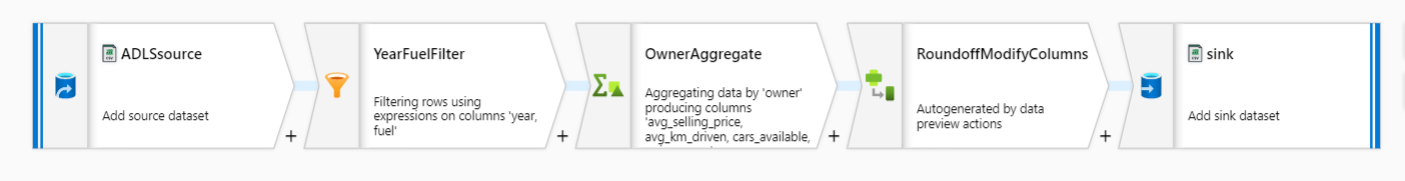
In the end, you will get something like the below image.
Building Transformation logic for RecommendCarsdataflow
Here, we will join the original dataset with the output from the previous pipeline after some modification and find the cars that are value for money.
-
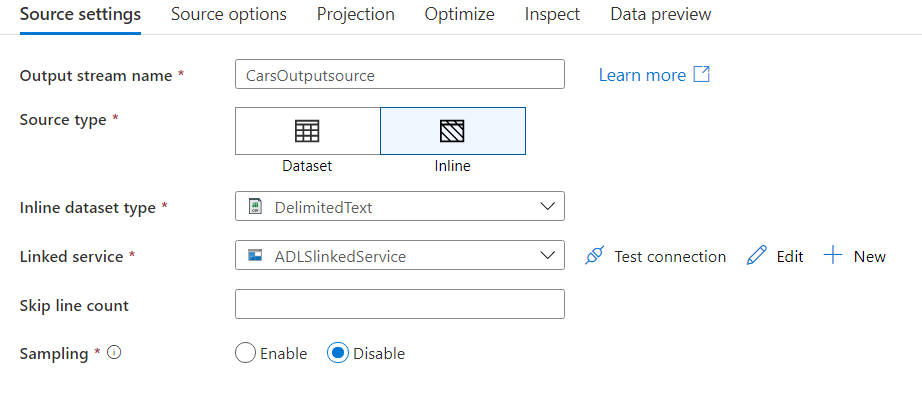
Create a source node, with the following details.

-
Next add a filter node and name it FuelFilter. Use the Filter on option to get only the “Petrol” cars. Write
fuel == "Petrol"in the expression box. -
Then add a select node and name it RemoveFuelSellertype. Make sure the incoming stream is FuelFilter. Let all the Options be checked. From the Input columns section delete the Fuel and seller_type column by clicking on the delete icon beside those columns.

-
Now add another source node with the following details.

-
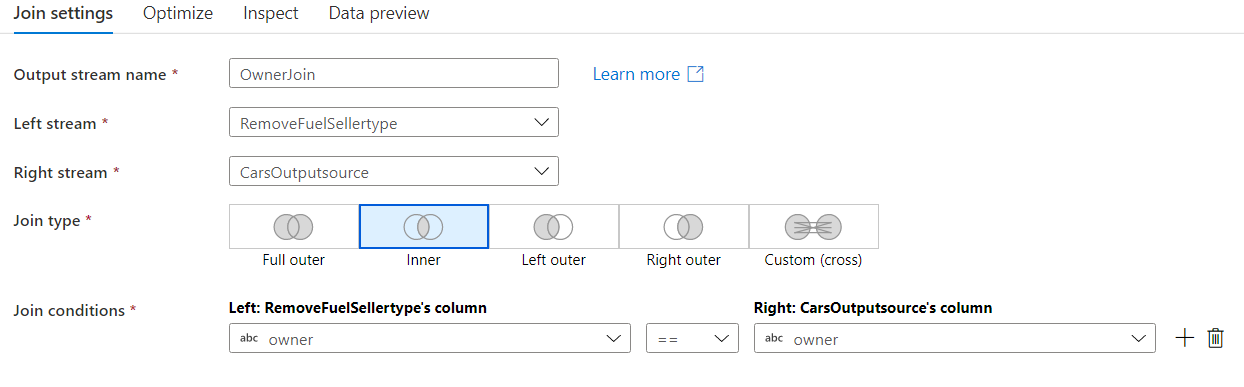
Add a Join node to the RemoveFuelSellertype node. Fill the details according to the images below.
-
Now add a filter node to OwnerJoin. Click on the expression box for the Filter on option and open the Visual expression builder.

Under Expression elements, select Parameters and click on create new to add Owner and type_of_transmission as parameters. Make both of them as string datatype and add “First Owner” as default value to Owner and “Manual” to type_of_transmission. Then, add the following code to the expression box:
(selling_price <= avg_selling_price) && (km_driven <= avg_km_driven) && rlike(transmission, $type_of_transmission) && rlike(CarsOutputsource@owner, $Owner)This will extract only the rows where the selling-price is less than the average selling-price, the kilometer driven is less than the average kilometer driven, transmission is equal to the value of type_of_transmission parameter and owner is equal to the value of owner parameter.
-
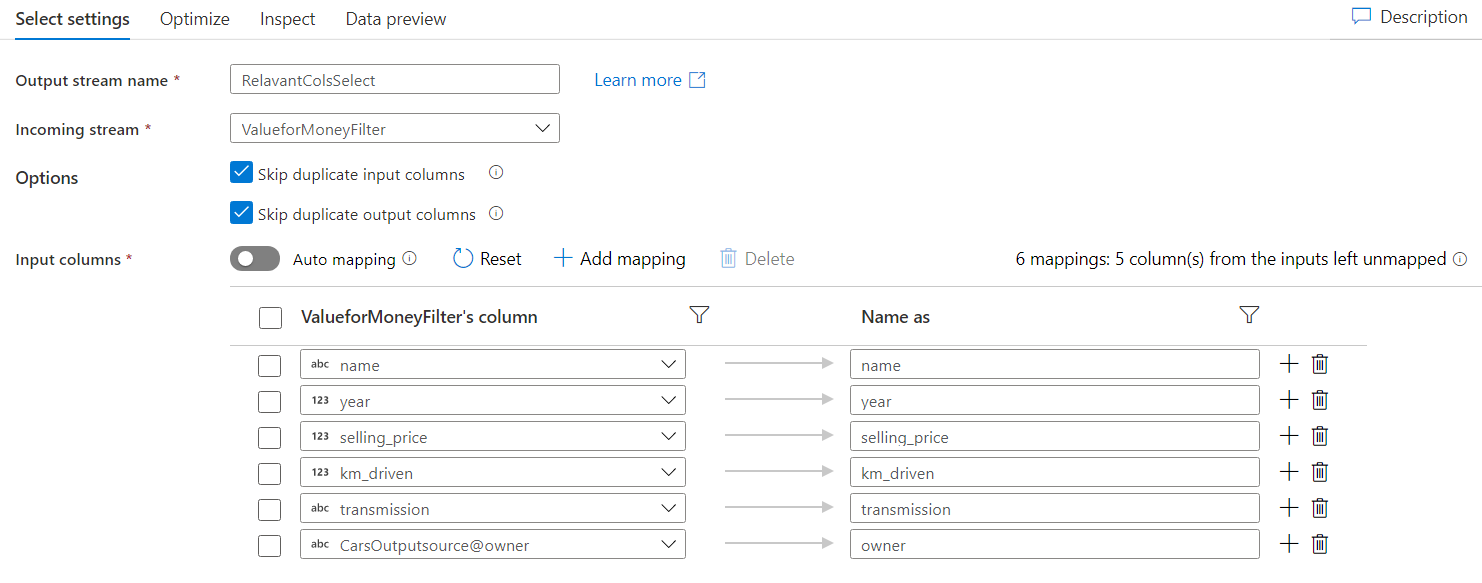
Add a Select node and delete the column that do not appear in the below image.
-
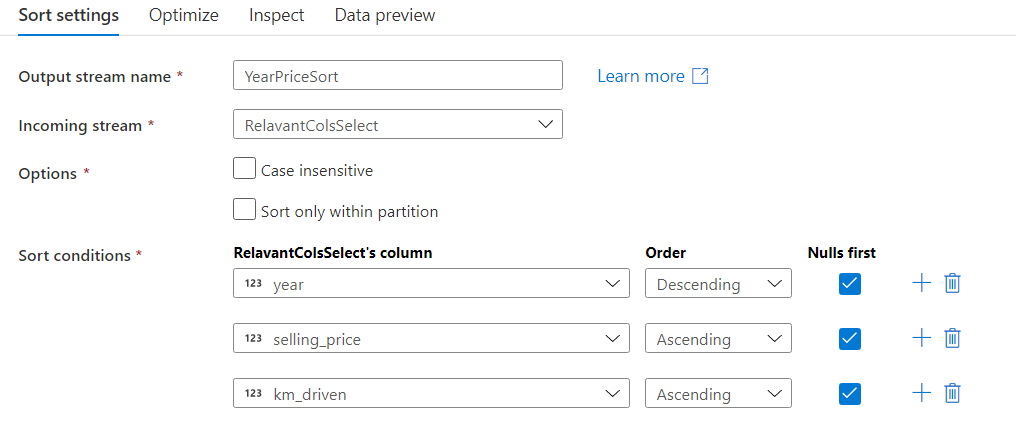
Now add the sort node. Fill-in with the details below.
-
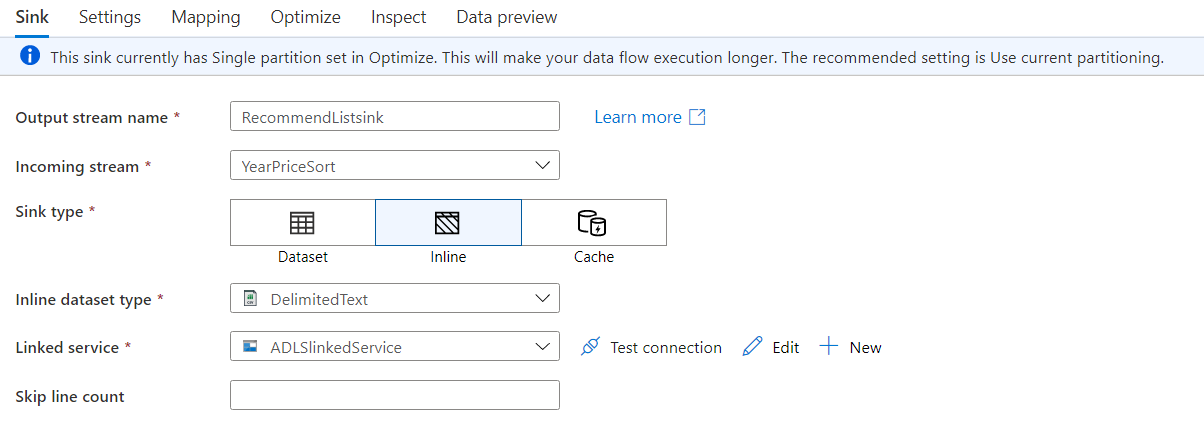
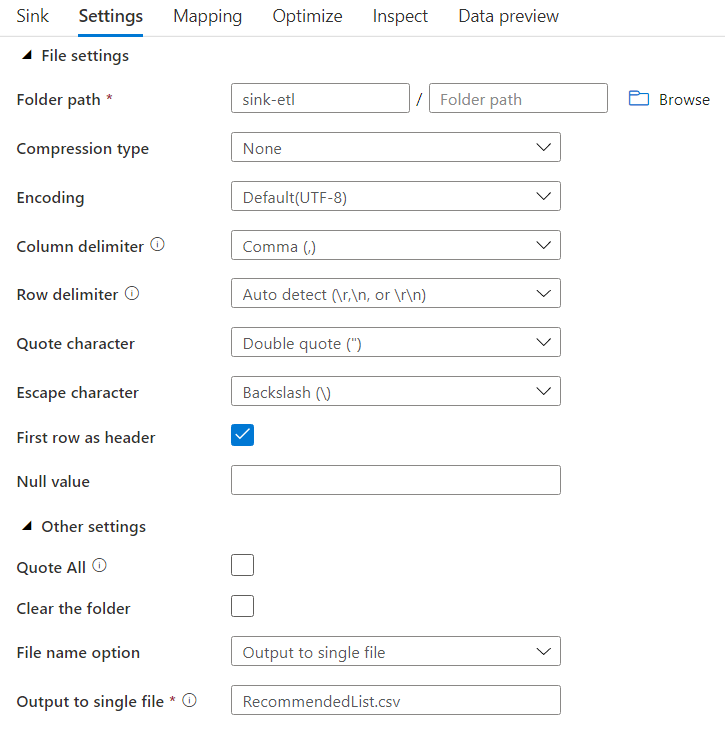
In the end add a sink node and fill in with required details.

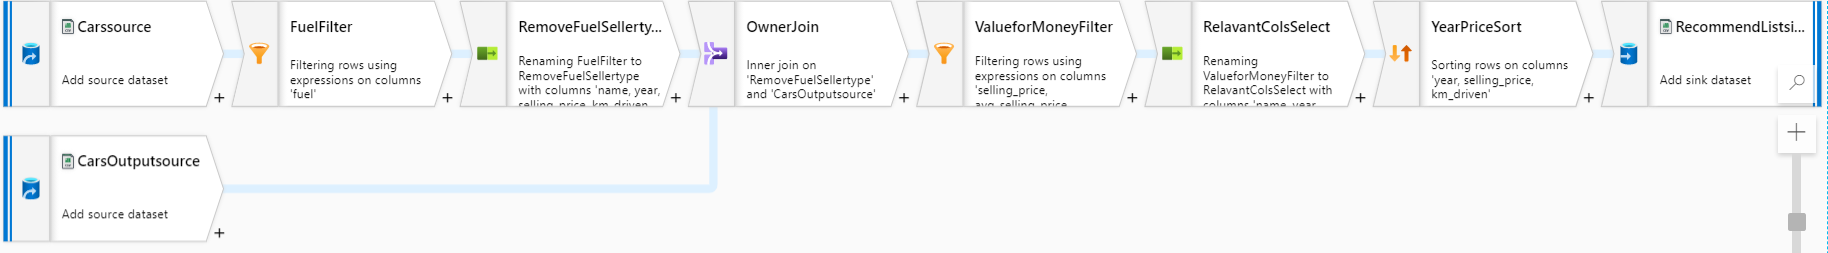
Finally, your data flow should look similar to the below image.
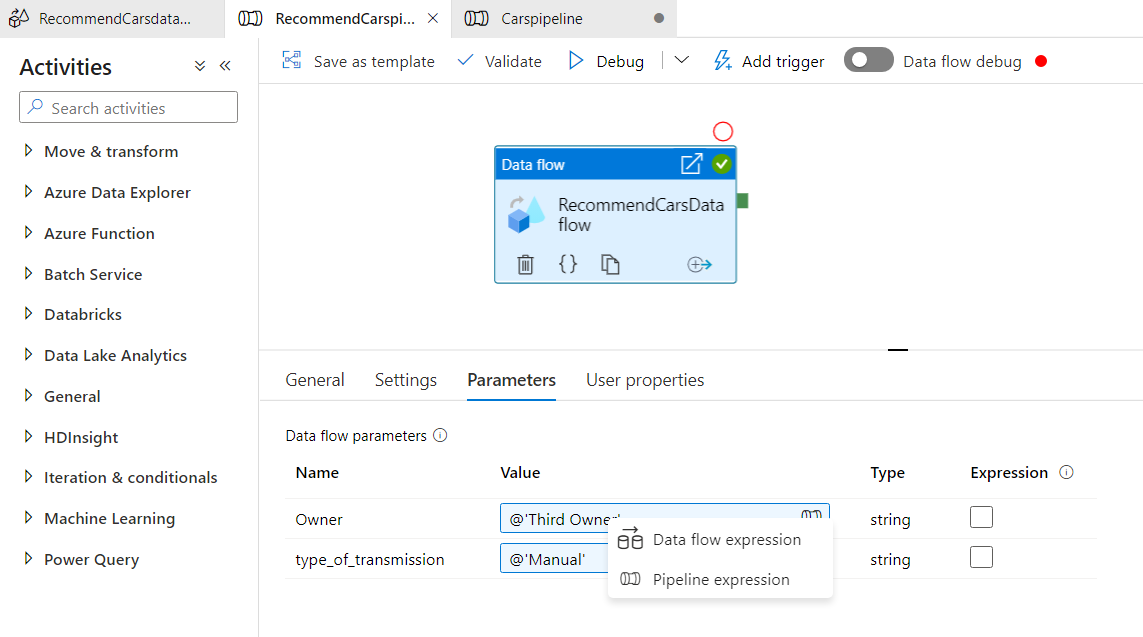
To change the value of the your parameters, go back to the RecommendCarspipeline and click on the Parameters tab. Click on the value field for any of the parameters and select pipeline expression and write the static value you want for that parameter.
Click Publish all button and save your pipeline.
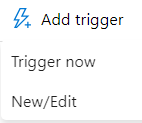
To trigger the Carspipeline, click on Add trigger and select Trigger now. You don’t have to trigger RecommendCarspipeline separately as the pipeline execute activity will trigger it automatically.
I ran the pipelines with the parameter Owner as “First Owner” and type_of_transmission as “Automatic”.
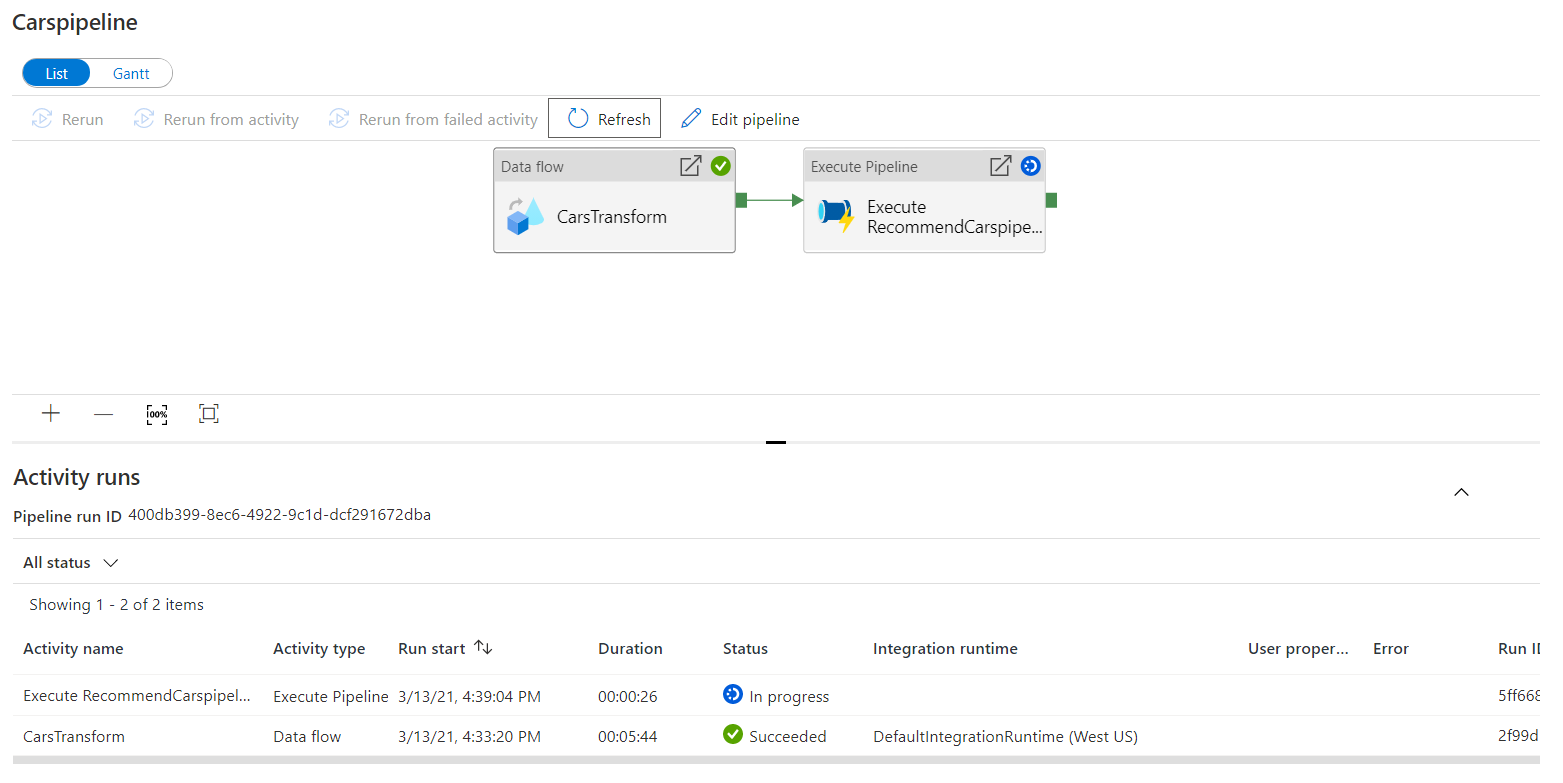
You can check the status of execution from the Monitor tab. Click on a specific pipeline, to monitor it in-depth. The below image shows the 2 pipelines in progress.

Note the duration for each pipeline in the below image.

When you click on Carspipeline, you can examine it in more detail.
The below image shows the processing time for each transformation of CarsTransform activity.

The image given below shows the processing time for each transformation of RecommendCarsData flow activity.

After you are satisfied with your work and downloaded all the output files, you can go ahead and delete all the resources in order to save money.
To view your files, you can open your storage account (as shown below).
