Using Azure Stream Analytics to analyze IOT data
I used a Raspberry Pi IoT online simulator to imitate a sensor that monitors and sends the air intake temperature and humidity of an automobile engine. I used this “IoT” data to analyze when the temperature and humidity is beyond a limit which hampers the engine’s fuel utilization efficiency. When the temperature or humidity crosses the permissible limit (Which is a assumed value here) for a certain time interval, I collect that data in a separate container which may be used for further analysis to estimate its affect on the engine’s life.
For people who are interested in knowing how air intake temperature and humidity affects an internal combustion engine’s fuel utilization capability, they can read this interesting piece of published paper, freely accessible.
I followed Microsoft’s blog, Quickstart: Create a Stream Analytics job by using the Azure portal, to create my stream analytics job and set-up my IOT Hub. It is a really helpful resource. You can find everything you will need to getup and running. So, I have written about only the things that I did and which is not mentioned in that blog.
Choosing the right storage account
For streaming data, the right storage will be such that it provides higher transaction rates and low, consistent latency. For this reason I chose BlockBlobStorage with premium performance which fulfills the requirement and is right for the streaming scenario.
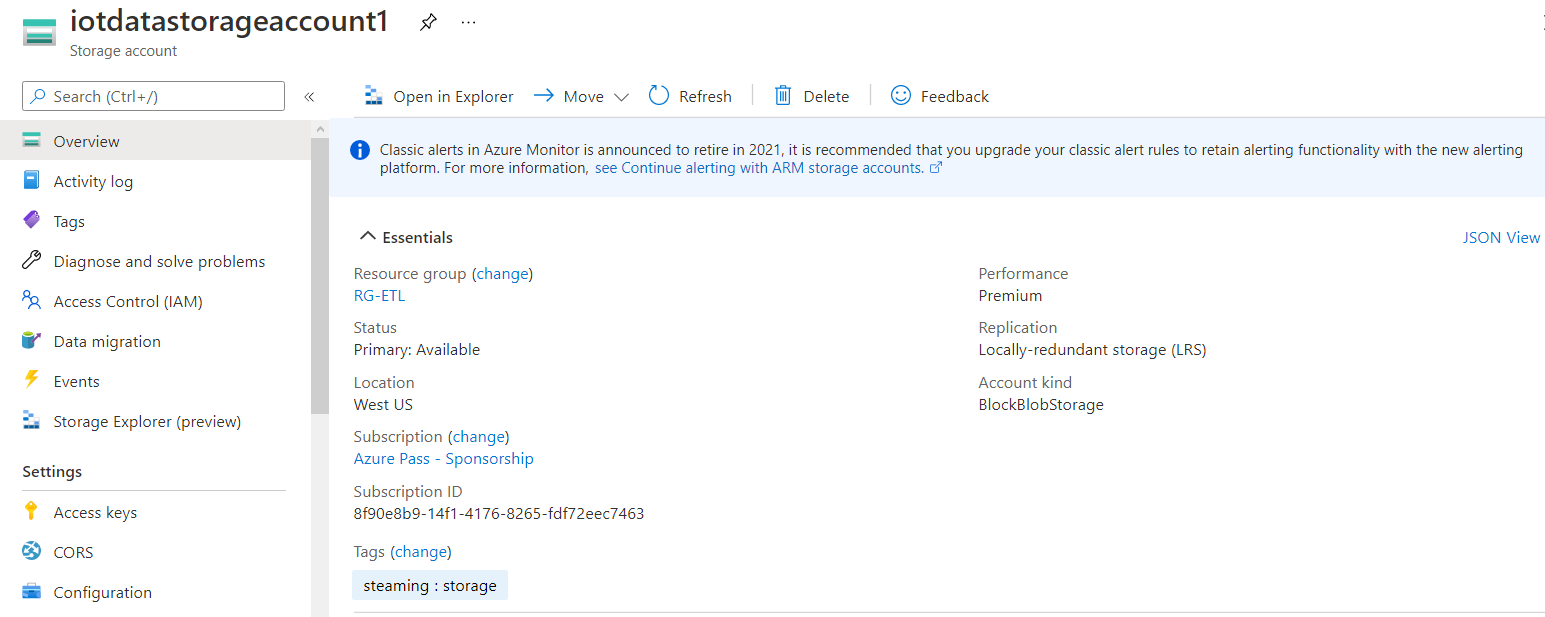
You can also go with StorageV2 and standard performance, which is the general purpose storage type.
I used Azure Data Lake Storage by checking the hierarchal namespace checkbox. The ADLS is optimized for big data analytics and IoT data use cases.
Creating 2 outputs
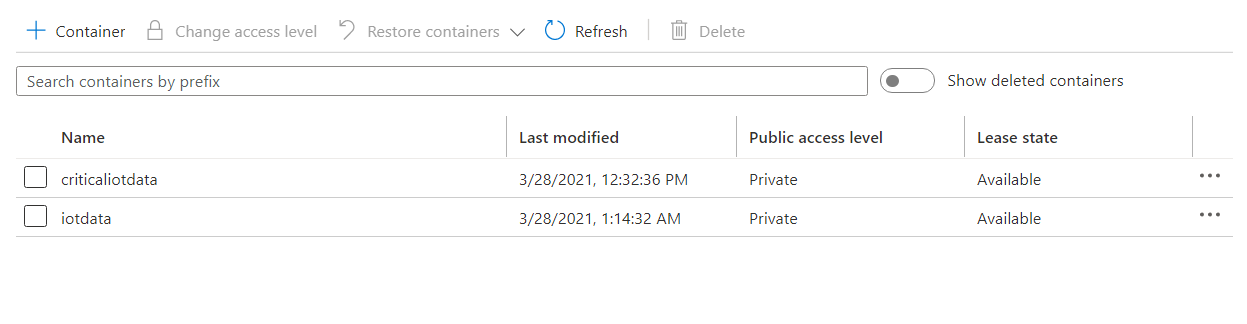
I created 2 outputs for the Stream Analytics job. One to collect all the data that was coming from my sensor and the other to collect the average temperature when it was greater than 30 degree Celsius and average [relative] humidity, when it was greater than 74% for more than 5 seconds. I stored the latter data as “critical data”.
This time interval confirms that the air is effecting the fuel efficiency of the engine as the air is warmer for ample amount of time.
I collected the data in JSON format by selecting it in the event serialization format when I created the output.
Query Logic
You can see the query in the image below.
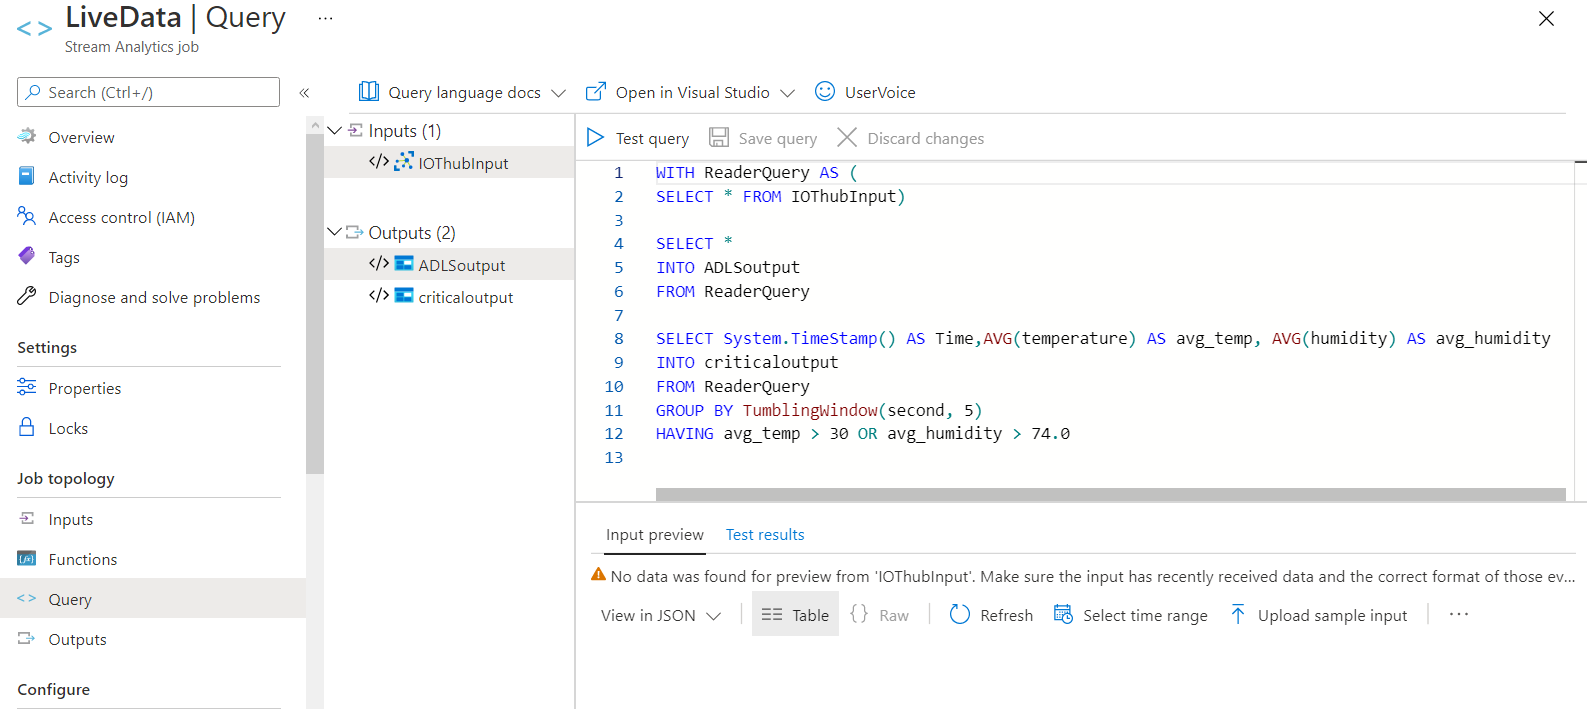
The first SELECT query is used to collect all the data and store it into a container, ADLSoutput. In the second SELECT query, I store the event’s timestamp, the average temperature and average humidity to a container called criticaloutput when the average temperature becomes more than 30 degrees Celsius or the average humidity becomes more than 74% for 5 seconds.
The WITH clause is be used to define multiple sub-query blocks. This option has the benefit of opening fewer readers to the input source. The INTO clause tells Stream Analytics which of the outputs to write the data to. I used the TumblingWindow windowing function to create a series of fixed-sized, non-overlapping and continuous time intervals and calculate the averages in these separate time intervals. System.TimeStamp() is a inbuilt function to retrieve an event’s timestamp. I added it as a column to identify one row of data from another and to get a better understanding of the IoT data.
Monitoring the incoming data
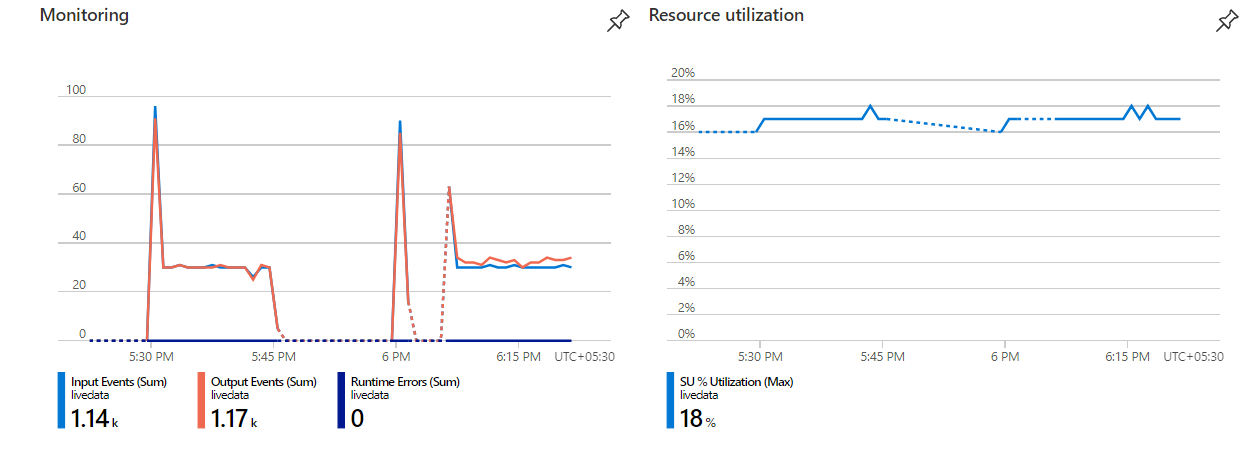
You can monitor input events and resource utilization from overview as shown in the image above. Notice that a total of 1140 events have been received by my stream analytics job called livedata and a total of 1170 events have been sent to the output targets. Since the job takes some time to start, the messages or the events are queued up and that is why there is a spike in the graph each time the job starts.
The resource utilization is 18% in the image above, which is well within limits. If it were to be around 80-90%, it is advisable to increase the Streaming Units assigned to the job, so that it can accommodate the increase in the rate of incoming events.
The image below shows that the total input event is 179.9 kb in size. It also shows in detail, the size of input received at various times. Most of the time, it is steady between 3 to 4 kb. You can view this chart for your job by clicking on Metrics, under Monitoring and selecting Input Event Bytes under metric.

In the end, you can view the data collected in the container, download it and make sure you stop the job and delete all the resources so that you are not charged anymore. This will help you save money.
